2022-07-17
GDB is an old and ubiquitous debugger for Linux and BSD systems that has extensive language, processor, and binary format support. Its interface is a little cryptic, but learning GDB pays off.
This article is a set of miscellaneous configuration and scripting tricks that illustrate reusable principles. It assumes you’re familiar with the basics of debugging, like breakpoints, stepping, inspecting variables, etc.
Table of contents
By default, GDB provides a terse line-based terminal. You need to explicitly ask to print the source code being debugged, the values of variables, or the current list of breakpoints. There are four ways to customize this interface. Ordered from basic to complicated, they are:
.gdbinit. Some good examples are projects like gdb-dashboard and
gef.In my experiments, the TUI mode (option two) seemed promising, but it has some limitations:
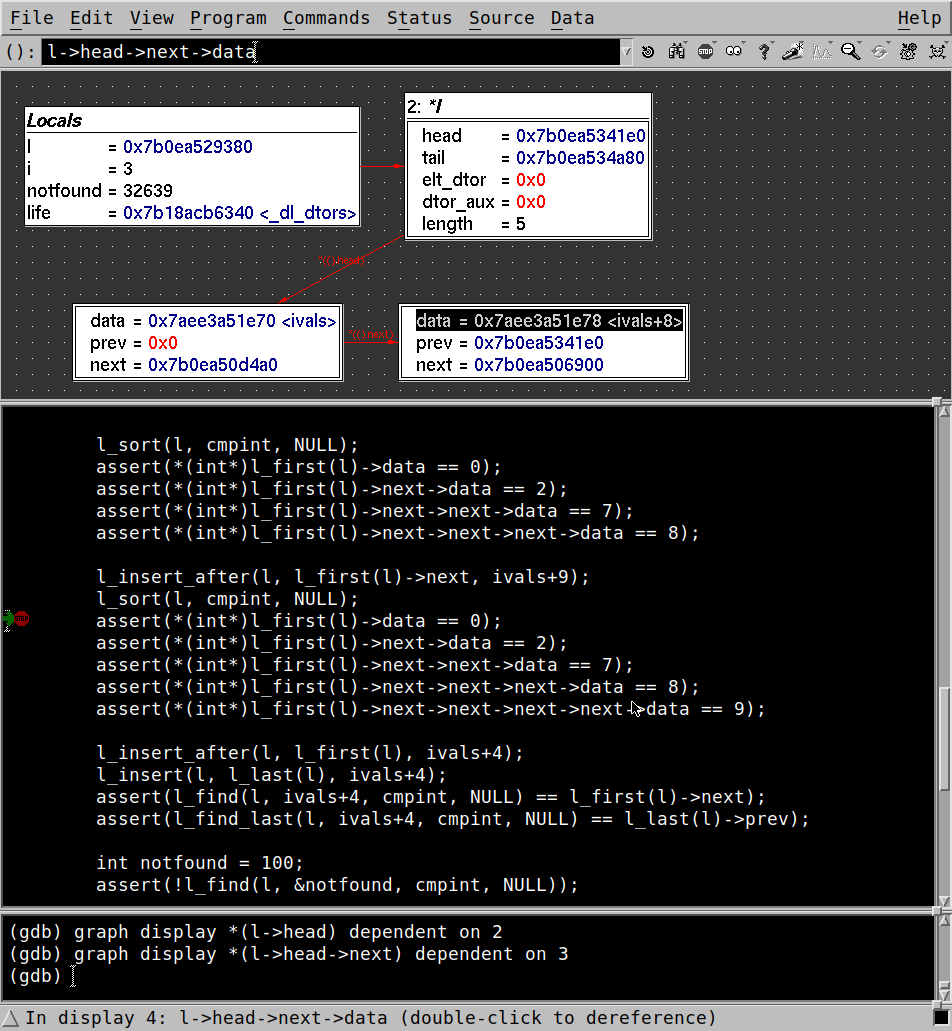
Ultimately I chose option four, with the Data Display Debugger (DDD). It’s fairly ancient, and requires configuration changes to work at all with recent versions of GDB. However, it has a lot of features delivered in a 3MB binary, with no library dependencies other than a Motif-compatible UI toolkit. DDD can also control GDB sessions remotely over SSH.
As a front-end, DDD translates user actions to text commands that it sends to GDB. Newer front-ends use GDB’s unambiguous machine interface (MI), but DDD never got updated for that. It parses the standard text interface, essentially screen scraping GDB’s regular output. This causes some problems, but there are workarounds.
Upon starting DDD, the first serious error you’ll run into is the program locking up with this message:
Waiting until GDB gets ready...The freeze happens because DDD is looking for the prompt
(gdb). However, DDD never sees that prompt because it
incorrectly changed the prompt at startup.
To fix this error, you must explicitly set the prompt and
unset the extended-prompt. In ~/.ddd/init include
this code:
Ddd*gdbSettings: \
unset extended-prompt\n\
set prompt (gdb) \n
The root of the problem is that during DDD’s first run, it probes all
GDB settings, and saves them in to its .ddd/init file for consistency in
future runs. It probes by running show settingname for all
settings. However, it interprets the results wrong for these
settings:
The incorrect detection is especially bad for
extended-prompt. GDB reports the value as
not set, which DDD interprets – not as the lack of a value
– but as text to set for the extended prompt. That text overrides the
regular prompt, causing GDB to output not set as its actual
prompt.
As mentioned, DDD probes and saves all GDB settings during first
launch. While specifying all settings in ~/.ddd/init might
make for deterministic behavior on local and remote debugging sessions,
it’s inflexible. I want ~/.gdbinit to be the source of
truth.
Thus you should:
Ddd*gdbSettings other than the prompt ones
above, andDdd*saveOptionsOnExit: off to prevent DDD from
putting the values back.DDD’s default color scheme is a bit glaring. For dark mode in the code window, console, and data display panel, set these resources:
Ddd*XmText.background:             black
Ddd*XmText.foreground:             white
Ddd*XmTextField.background:        black
Ddd*XmTextField.foreground:        white
Ddd*XmList.background:             black
Ddd*XmList.foreground:             white
Ddd*graph_edit.background:         #333333
Ddd*graph_edit.edgeColor:          red
Ddd*graph_edit.nodeColor:          white
Ddd*graph_edit.gridColor: whiteBy default, DDD uses X core fonts. All its resources, like
Ddd*defaultFont, can pick from only those legacy fonts,
which don’t properly render UTF-8. For proper rendering, we have to
change the Motif rendering
table to use the newer FreeType (XFT) fonts. Pick an XFT font you
have on your system; I chose Inconsolata:
Ddd*renderTable: rt
Ddd*rt*fontType: FONT_IS_XFT
Ddd*rt*fontName: Inconsolata
Ddd*rt*fontSize: 8
The change applies to all UI areas of the program except the
data display window. That window comes from an earlier codebase bolted
on to DDD, and I don’t know how to change its rendering. AFAICT, you can
choose only legacy fonts there, with Ddd*dataFont and
Ddd*dataFontSize.
Although international graphemes are garbled in the data display window, you can inspect UTF-8 variables by printing them in the GDB console, or by hovering the mouse over variable names for a tooltip display.
DDD interacts with GDB through the terminal like a user would, so it
can drive debugging sessions over SSH just as easily as local sessions.
It also knows how to fetch remote source files, and find remote program
PIDs to which GDB can attach. DDD’s default program for running commands
on a remote inferior is remsh or rsh, but it
can be customized to use SSH:
Ddd*rshCommand: ssh -tIn my experience, the -t is needed, or else GDB warnings
and errors can appear out of order with the (gdb) prompt,
making DDD hang.
To debug a remote GDB over SSH, pass the --host option
to DDD. I usually include these command-line options:
ddd --debugger gdb --host admin@example.com --no-exec-window(I specify the remote debugger command as gdb when it
differs from my local inferior debugger command of egdb
from the OpenBSD devel/gdb port.)
Beyond the basics of run, continue and
next, don’t forget some other handy commands.
finish - execute until the current function returns,
and break in caller. Useful if you accidentally go too deep, or if the
rest of a function is of no interest.until - execute until reaching a later line. You can
use this on the last line of a loop to run through the rest of the
iterations, break out, and stop.start - create a temporary breakpoint on the first line
of main() and then run. Starts the program and
breaks right away.step vs next - how to remember the
difference? Think a flight of “steps” goes downward, “stepping down”
into subroutines. Whereas “next” is the next contiguous source
line.GDB can be used non-interactively, with predefined scripts, to create little utility programs. For example, the poor man’s profiler is a technique of calling GDB repeatedly to sample the call stack of a running program. It sends the results to awk to tally where most wall clock time (as opposed to just CPU time) is being spent.
A related idea is using GDB to print information about a core dump without leaving the UNIX command line. We can issue a single GDB command to list the backtraces for all threads, plus all stack frame variables and function arguments. Notice the print settings customized for clean, verbose output.
# show why program.core died

gdb --batch \
  -ex "set print frame-arguments all" \
  -ex "set print pretty on" \
  -ex "set print addr off" \
  -ex "thread apply all bt full" \
  /path/to/program program.core
You can put this incantation (minus the final program and core file
paths) into a shell alias (like bt) so you can run it more
easily. To test, you can generate a core by running a program and
sending it SIGQUIT with Ctrl-\. Adjusting
ulimit -c may also be necessary to save cores, depending on
your OS.
GDB allows you to define custom commands that can do arbitrarily complex things. Commands can set breakpoints, display values, and even call to the shell.
Here’s an example that does a few of these things. It traces the system calls made by a single function of interest. The real work happens by shelling out to OpenBSD’s ktrace(1). (An equivalent tracing utility should exist for your operating system.)
define ktrace
    # if a user presses enter on a blank line, GDB will by default
    # repeat the command, but we don't want that for ktrace

    dont-repeat

    # set a breakpoint for the specified function, and run commands
    # when the breakpoint is hit

    break $arg0
    commands
        # don't echo the commands to the user
        silent

        # set a convenience variable with the result of a C function
        set $tracepid = (int)getpid()

        # eval (GDB 7.2+) interpolates values into a command, and runs it
        eval "set $ktraceout=\"/tmp/ktrace.%d.out\"", $tracepid
        printf "ktrace started: %s\n", $ktraceout
        eval "shell ktrace -a -f %s -p %d", $ktraceout, $tracepid

        printf "\nrun \"ktrace_stop\" to stop tracing\n\n"

        # "finish" continues execution for the duration of the current
        # function, and then breaks
        finish

        # After commands that continue execution, like finish does,
        # we lose control in the GDB breakpoint. We cannot issue
        # more commands here
    end

    # GDB automatically sets $bpnum to the identifier of the created breakpoint
    set $tracebp = $bpnum
end

define ktrace_stop
    dont-repeat

    # consult $ktraceout and $tracebp set by ktrace earlier

    eval "shell ktrace -c -f %s", $ktraceout
    del $tracebp
    printf "ktrace stopped for %s\n", $ktraceout
end
Here’s demonstration with a simple program. It has two functions that involve different kinds of system calls:
#define _POSIX_C_SOURCE 200112L

#include <stdio.h>
#include <unistd.h>

void delay(void)
{
    sleep(1);
}

void alert(void)
{
    puts("Hello");
}

int main(void)
{
    alert();
    delay();
}
After loading the program into GDB, here’s how to see which syscalls
the delay() function makes. Tracing is focused to just that
function, and doesn’t include the system calls made by any other
functions, like alert().
(gdb) ktrace delay
Breakpoint 1 at 0x1a10: file sleep.c, line 7.
(gdb) run
Starting program: sleep
ktrace started: /tmp/ktrace.5432.out

run "ktrace_stop" to stop tracing

main () at sleep.c:20
(gdb) ktrace_stop
ktrace stopped for /tmp/ktrace.5432.out
The trace output is a binary file, and we can use kdump(1) to view it, like this:
$ kdump -f /tmp/ktrace.5432.out
  5432 sleep    CALL  kbind(0x7f7ffffda6a8,24,0xa0ef4d749fb64797)
  5432 sleep    RET   kbind 0
  5432 sleep    CALL  nanosleep(0x7f7ffffda748,0x7f7ffffda738)
  5432 sleep    STRU  struct timespec { 1 }
  5432 sleep    STRU  struct timespec { 0 }
  5432 sleep    RET   nanosleep 0
This shows that, on OpenBSD, sleep(3) calls nanosleep(2).
On a related note, another way to get insight into syscalls is by setting catchpoints to break on a call of interest. This is a Linux-only feature.
GDB treats user defined commands specially whose names begin with
hook- or hookpost-. It runs
hook-foo (hookpost-foo) automatically before
(after) a user runs the command foo. In addition, a
pseudo-command “stop” exists for when execution stops at a
breakpoint.
As an example, consider automatic
variable displays. GDB can automatically print the value of
expressions every time the program stops with,
e.g. display varname. However, what if we want to display
all local variables this way?
There’s no direct expression to do it with display, but
we can create a hook:
define hook-stop
    # do it conditionally
    if $display_locals_flag
        # dump the values of all local vars
        info locals
    end
end

# commands to (de)activate the display

define display_locals
    set $display_locals_flag = 1
end

define undisplay_locals
    set $display_locals_flag = 0
end
To be fair, the TUI
single key mode binds info locals to the v
key, so our hook is less useful in TUI mode than it first appears.
GDB exposes a Python
API for finer control over the debugger. GDB scripts can include
Python directly in designated blocks. For instance, right in
.gdbinit we can access the Python API to get call stack
frame information.
In this example, we’ll trace function calls matching a regex. If no regex is specified, we’ll match all functions visible to GDB, except low level functions (which start with underscore).
# drop into python to access frame information

python
    # this module contains the GDB API

    import gdb

    # define a helper function we can use later in a user command
    #
    # it prints the name of the function in the specified frame,
    # with indentation depth matching the stack depth

    def frame_indented_name(frame):
        # frame.level() is not always available,
        # so we traverse the list and count depth

        f = frame
        depth = 0
        while (f):
            depth = depth + 1
            f = f.older()
        return "%s%s" % ("  " * depth, frame.name())
end

# trace calls of functions matching a regex

define ftrace
    dont-repeat

    # we'll set possibly many breakpoints, so record the
    # starting number of the group

    set $first_new = 1 + ($bpnum ? $bpnum : 0)

    if $argc < 1
        # by default, trace all functions except those that start with
        # underscore, which are low-level system things
        #
        # rbreak sets multiple breakpoints via a regex

        rbreak ^[a-zA-Z]
    else
        # or match based on ftrace argument, if passed

        rbreak $arg0
    end
    commands
        silent

        # drop into python again to use our helper function to
        # print the name of the newest frame

        python print(frame_indented_name(gdb.newest_frame()))

        # then immediately keep going
        cont
    end

    printf "\nTracing enabled. To disable, run:\n\tdel %d-%d\n", $first_new, $bpnum
end
To use ftrace, put breakpoints at either end of an area of interest. When you arrive at the first breakpoint, run ftrace with an optional regex argument. Then, continue the debugger and watch the output.
Here’s sample trace output from inserting a key-value into a treemap
(tm_insert()) in my libderp library. You can
see the “split” and “skew” operations happening in the underlying
balanced AA-tree.
tm_insert
  malloc
    omalloc
  malloc
    omalloc
          map
          insert
  internal_tm_insert
    derp_strcmp
    internal_tm_insert
      derp_strcmp
      internal_tm_insert
        derp_strcmp
        internal_tm_insert
        internal_tm_skew
        internal_tm_split
      internal_tm_skew
      internal_tm_split
    internal_tm_skew
internal_tm_splitGDB allows you to customize the way it displays values. For instance, you may want to inspect Unicode strings when working with the ICU library. ICU’s internal encoding for UChar is UTF-16. GDB has no way to know that an array ostensibly containing numbers is actually a string of UTF-16 code units. However, using the Python API, we can convert the string to a form GDB understands.
While a bit esoteric, this example provides the template you would use to create pretty printers for any type.
import gdb.printing, re

# a pretty printer

class UCharPrinter:
    'Print ICU UChar string'

    def __init__(self, val):
        self.val = val

    # tell gdb to print the value in quotes, like a string
    def display_hint(self):
        return 'string'

    # the actual work...
    def to_string(self):
        p_c16 = gdb.lookup_type('char16_t').pointer()
        return self.val.cast(p_c16).string('UTF-16')

# bookkeeping that associates the UCharPrinter with the types
# it can handle, and adds an entry to "info pretty-printer"

class UCharPrinterInfo(gdb.printing.PrettyPrinter):
    # friendly name for printer
    def __init__(self):
        super().__init__('UChar string printer')
        self._re = re.compile('^UChar [\[*]')

    # is UCharPrinter appropriate for val?
    def __call__(self, val):
        if self._re.match(str(val.type)):
            return UCharPrinter(val)
While it’s nice to create code such as the pretty printer above, the
code won’t do anything until we tell GDB how and when to load it. You
can certainly dump Python code blocks into your ~/.gdbinit,
but that’s not very modular, and can load things unnecessarily.
I prefer to organize the code in dedicated directories like this:
mkdir -p ~/.gdb/{py-modules,auto-load}The ~/.gdb/py-modules is for user modules (like the ICU
pretty printer), and ~/.gdb/auto-load is for scripts that
GDB automatically loads at certain times.
Having created those directories, tell GDB to consult them. Add this
to your ~/.gdbinit:
add-auto-load-safe-path /home/foo/.gdb
add-auto-load-scripts-directory /home/foo/.gdb/auto-load
Now, when GDB loads a library like /usr/lib/baz.so.x.y
on behalf of your program, it will also search for
~/.gdb/auto-load/usr/lib/baz.so.x.y-gdb.py and load it if
it exists. To see which libraries GDB loads for an application, enable
verbose mode, and then start execution.
(gdb) set verbose
(gdb) start

...
Reading symbols from /usr/libexec/ld.so...
Reading symbols from /usr/lib/libpthread.so.26.1...
Reading symbols from ...
On my machine for an application using ICU, GDB loaded
/usr/local/lib/libicuio.so.20.1. To enable the ICU pretty
printer, I create an auto-load file:
# ~/.gdb/auto-load/usr/local/lib/libicuuc.so.20.1-gdb.py

import gdb.printing
import printers.libicuuc

gdb.printing.register_pretty_printer(
    gdb.current_objfile(),
    printers.libicuuc.UCharPrinterInfo())
The final question is how the auto-loader resolves the
printers.libicuuc module. We need to add
~/.gdb/py-modules to the Python system path. I use a little
trick: a file in the appropriate directory that detects its own location
and adds that to the syspath:
# ~/.gdb/py-modules/add-syspath.py

import sys, os

sys.path.append(os.path.dirname(os.path.realpath(__file__)))
Then just source the file from ~/.gdbinit:
source /home/foo/.gdb/py-modules/add-syspath.pyAfter doing that, save the ICU pretty printing code as
~/.gdb/py-modules/printers/libicuuc.py, and the
import printers.libicuuc statement will find it.
In addition to providing a graphical user interface, DDD has a few features of its own.
Each time the program stops at a breakpoint, DDD records the values of all displayed variables. You can place breakpoints strategically to sample the historical values of a variable, and then view or plot them on a graph.
For instance, compile this program with debugging information enabled, and load it in DDD:
int main(void)
{
    unsigned x = 381;
    while (x != 1)
        x = (x % 2 == 0) ? x/2 : 3*x + 1;
    return 0;
}
Double click to the left of the x = ... line to set
a breakpoint. Right click the stop sign icon that appears, and select
Properties…. In the dialog box, click Edit
>> and enter continue into the text box.
Apply your change and close the dialog. This breakpoint will stop,
record the value of x, then immediately continue
running.
Set a breakpoint on the return 0 line.
Select GDB console from the View menu (or press Alt-1).
Run start in the GDB console to run the program and
break at the first line.
Double click the “x” variable to add it to the graphical display. (If you don’t put it in the display window, DDD won’t track its values over time.)
Select Continue from the
Program menu (or press F9). You’ll see the displayed
value of x updating rapidly.
When execution stops at the last breakpoint, run
graph history x in the GDB console. It will output an array
of all previous values:
(gdb) graph history x
history x = {0, 381, 1144, 572, 286, 143, 430, 215, 646, 323, 970, 485,
1456, 728, 364, 182, 91, 274, 137, 412, 206, 103, 310, 155, 466, 233, 700, 350,
175, 526, 263, 790, 395, 1186, 593, 1780, 890, 445, 1336, 668, 334, 167, 502,
251, 754, 377, 1132, 566, 283, 850, 425, 1276, 638, 319, 958, 479, 1438, 719,
2158, 1079, 3238, 1619, 4858, 2429, 7288, 3644, 1822, 911, 2734, 1367, 4102,
2051, 6154, 3077, 9232, 4616, 2308, 1154, 577, 1732, 866, 433, 1300, 650, 325,
976, 488, 244, 122, 61, 184, 92, 46, 23, 70, 35, 106, 53, 160, 80, 40, 20, 10,
5, 16, 8, 4, 2, 1}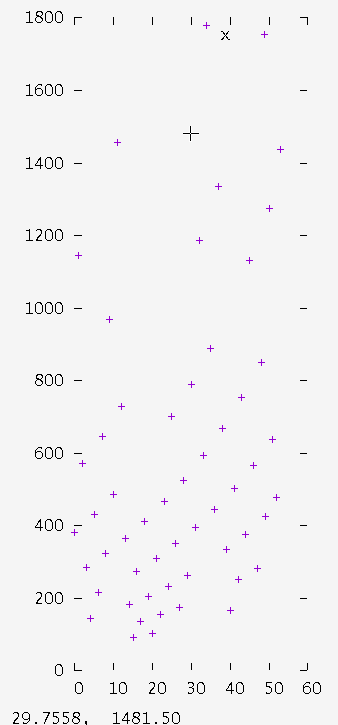
To see the values plotted graphically, run
graph plot `graph display x`DDD sends the data to gnuplot to render the graph. (Be sure to set
Ddd*plotTermType: x11 in ~/.ddd/init, or else
DDD will hang with a dialog saying “Starting Gnuplot…”.)
DDD has some shortcuts that aren’t obvious from the interface, but which I found interesting in the documentation.
Written by Joe "begriffs" Nelson